

Prometheus is an open-source monitoring framework. It provides out-of-the-box monitoring capabilities for the Kubernetes container orchestration platform. It is the most widely used monitoring tool for the Kubernetes cluster. There are some unique challenges to monitor the Kubernetes cluster. This needs to be addressed by deploy reliable monitoring, alerting and graphing architecture. Prometheus covers a full stack of Kubernetes cluster components, deployed microservices, alerts and dashboards. Prometheus have four unique characteristics to make the tool stand out for Kubernetes monitoring.
- Key value pair based – Multi-dimensional data model
- Accessible format and protocols
- Service discovery
- Modular and high available components
Challenges of Kubernetes Monitoring:
Monitoring the Kubernetes cluster is challenging due to the dynamic nature of the workloads.
- Monitoring containers: Containers are lightweight, mostly immutable, which brings monitoring challenges.
- Dynamic monitoring: Kubernetes is changing and volatile infrastructure. You need a roboust autodiscovery mechanisum to tackle this. Prometheus supports Consul, Kubernetes REST API etc.. to automatically generate monitoring target configurations based on familiar Kubernetes label queries.
- Monitoring new layers of infrastructure: You need to organize monitoring around different groupings like microservice performance, namespace, deployment versions, etc. which spans across multiple nodes. Using the label-based data model of Prometheus together with the PromQL can solve this challenges.

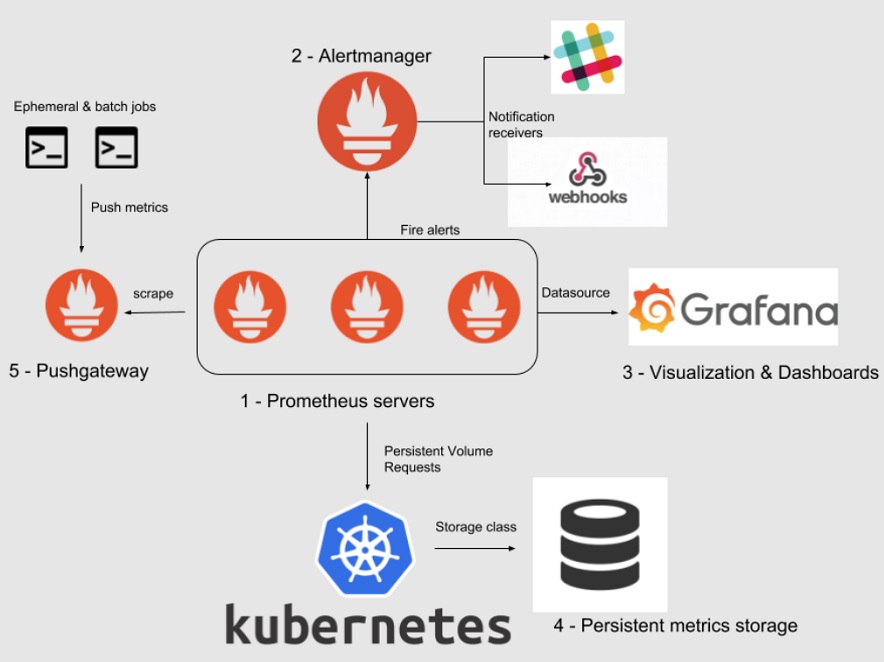
Image – https://sysdig.com
Prometheus Deployment:
- Assuming the Kubernetes cluster is up and running. Connect to your Kubernetes cluster and make sure you have admin privileges.
[root@kmaster ~]# kubectl get clusterrolebinding |head
NAME                                                   ROLE                                                               AGE
argocd-application-controller                          ClusterRole/argocd-application-controller                          8d
argocd-server                                          ClusterRole/argocd-server                                          8d
cluster-admin                                          ClusterRole/cluster-admin                                          9d
cluster-autoscaler-updateinfo                          ClusterRole/read-updateinfo                                        9d
event-exporter-rb                                      ClusterRole/view                                                   9d
gce:beta:kubelet-certificate-bootstrap                 ClusterRole/gce:beta:kubelet-certificate-bootstrap                 9d
gce:beta:kubelet-certificate-rotation                  ClusterRole/gce:beta:kubelet-certificate-rotation                  9d
2. If your Kubernetes cluster is on GKE, create the cluster roles for the Prometheus setup.
[root@kmaster ~]# ACCOUNT=$(gcloud info --format='value(config.account)')
[root@kmaster ~]# kubectl create clusterrolebinding owner-cluster-admin-binding --clusterrole cluster-admin --user $ACCOUNT
clusterrolebinding.rbac.authorization.k8s.io/owner-cluster-admin-binding created
[root@kmaster ~]#
[root@kmaster ~]# kubectl get clusterrolebinding |grep owner-cluster-admin-binding
owner-cluster-admin-binding                            ClusterRole/cluster-admin                                          48s
[root@kmaster ~]#
3. Clone the Prometheus Github repo.
[root@kmaster ~]# git clone https://github.com/UnixArena/gke-prometheus.git
Cloning into 'gke-prometheus'...
remote: Enumerating objects: 96, done.
remote: Counting objects: 100% (42/42), done.
remote: Compressing objects: 100% (40/40), done.
remote: Total 96 (delta 18), reused 11 (delta 2), pack-reused 54
Unpacking objects: 100% (96/96), done.
[root@kmaster ~]#
4. Create a new namespace for Prometheus.
[root@kmaster ~]# kubectl create namespace monitor-prometheus
namespace/monitor-prometheus created
[root@kmaster ~]#
5. Navigate to the cloned repository and list the files
[root@kmaster ~]# cd gke-prometheus
[root@kmaster prometheus]#
[root@kmaster kubernetes-prometheus]# ls -lrt
total 32
-rw-r--r--. 1 root root  627 Jul 29 11:09 README.md
-rw-r--r--. 1 root root  618 Jul 29 11:09 clusterRole.yaml
-rw-r--r--. 1 root root  962 Jul 29 11:09 prometheus-deployment.yaml
-rw-r--r--. 1 root root 5093 Jul 29 11:09 config-map.yaml
-rw-r--r--. 1 root root  315 Jul 29 11:09 prometheus-service.yaml
[root@kmaster kubernetes-prometheus]#
6. Create the Clusterrole and clusterRolebinding using the “ClusterRole.yaml”.
[root@kmaster prometheus]# kubectl create -f clusterRole.yaml
clusterrole.rbac.authorization.k8s.io/prometheus created
clusterrolebinding.rbac.authorization.k8s.io/prometheus created
[root@kmaster prometheus]#
7. Create the config map.
[root@kmaster prometheus]# kubectl create -f config-map.yaml
configmap/prometheus-server-conf created
[root@kmaster prometheus]#
8. Create the Prometheus deployment.
[root@kmaster prometheus]# kubectl create  -f prometheus-deployment.yaml
deployment.apps/prometheus-deployment created
[root@kmaster prometheus]# kubectl get deployments --namespace=monitor-prometheus
NAME                    READY   UP-TO-DATE   AVAILABLE   AGE
prometheus-deployment   1/1     1            1           22s
[root@kmaster prometheus]# kubectl get pods --namespace=monitor-prometheus
NAME                                    READY   STATUS    RESTARTS   AGE
prometheus-deployment-87cc8fb88-549tt   1/1     Running   0          59s
[root@kmaster prometheus]#
9. You need to expose the Prometheus service to load balancer or ClusterIP to access the dashboard. Since my cluster is running on GKE, I will use a load balancer.
[root@kmaster prometheus]# cat prometheus-service.yaml
apiVersion: v1
kind: Service
metadata:
  name: prometheus-service
  namespace: monitor-prometheus
  annotations:
      prometheus.io/scrape: 'true'
      prometheus.io/port:   '9090'
spec:
  selector:
    app: prometheus-server
  type: LoadBalancer
  ports:
    - port: 8086
      targetPort: 9090
[root@kmaster prometheus]#
[root@kmaster prometheus]# kubectl create -f prometheus-service.yaml --namespace=monitor-prometheus
service/prometheus-service created
[root@kmaster prometheus]#
10. Identify the Loadbalancer IP to access the Prometheus UI.
[root@kmaster prometheus]# kubectl get svc --namespace=monitor-prometheus
NAME                 TYPE           CLUSTER-IP      EXTERNAL-IP      PORT(S)          AGE
prometheus-service   LoadBalancer   10.116.10.205   34.xx2.xx0.119   8086:32753/TCP   2d1h
[root@kmaster prometheus]#
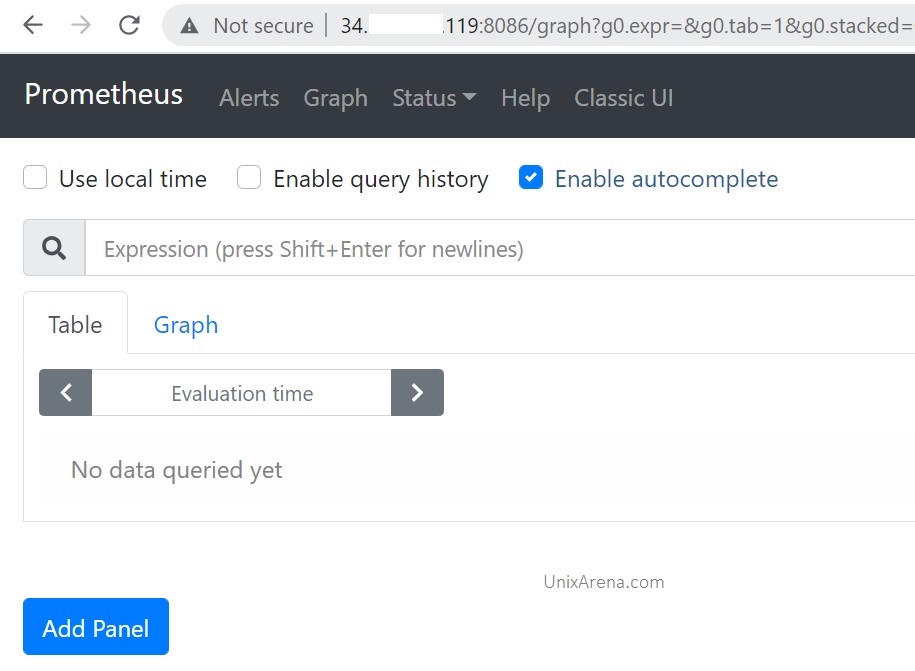
11. Open the web browser and access the Prometheus using the external IP and port.

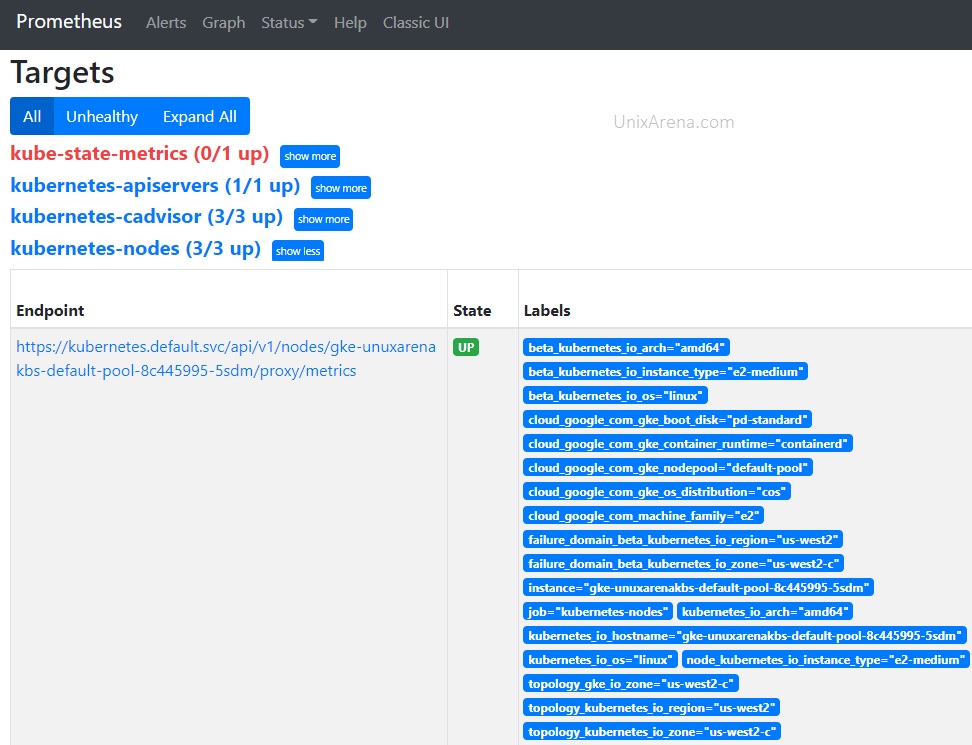
12. To see the Kubernetes endpoints connected to Prometheus automatically using service discovery, navigate to status – > targets.

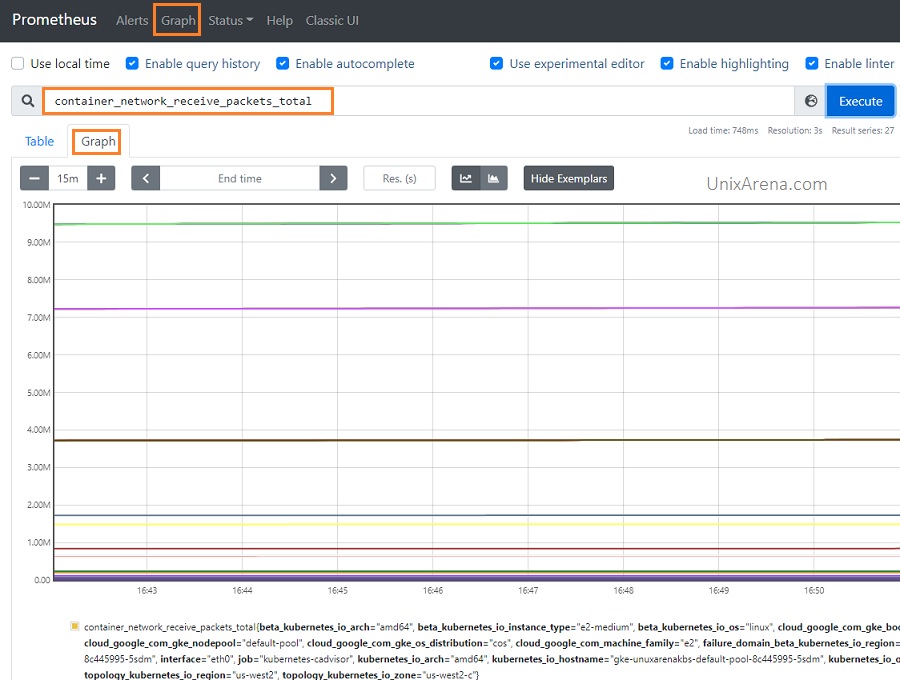
13. Navigate to graph and run some queries.

In the production monitoring environment, Grafana will be used for dashboards using Prometheus metrics to monitor the Kubernetes cluster. For enterprise Kubernetes cluster monitoring, you need to consider more configuration and parameters for scaling and storage. Power your metrics and alerting with a leading open-source monitoring solution.
Please share your Kubernetes monitoring experience and toolset here to help the community.