


Cloudstats.me is the Next-Gen server/website monitoring platform which suits for Linux, windows servers and enterprise websites. I have been worked with several enterprise monitoring tools but Cloudstats stands out with it’s simplicity. You no need to spend thousands of dollors to buy the monitoring software and hire the resources to setup the monitoring services platform. Also you no need to spend single penny for the hardwares and datacenter space. Cloudstats provides world’s most simple and effective monitoring platform where your systems are monitored in the cloud in few clicks. In this article, we will see that how we can setup the Cloudstats monitoring for Rehdat Enterprise Linux 7/Cent OS .
[box type=”success” align=”” class=”” width=””]CloudStats also has a completely free account for those who plan to monitor 3 servers or less servers.[/box]
Use the below link to sign-up in the cloudstats.me . Its completely free to monitor to to three servers or websites. Your system must have internet access to get connected with cloudstats.
http://login.cloudstats.me/referrals?ref=1391
Features of Cloudstats.me:
- Linux and Windows Server Monitoring.
- It Supports CentOS, Debian, Ubuntu and Windows servers.
- Support of VPS, Dedicated and Cloud servers.
- Simple agent installation.
- Website Monitoring and Pingmap.
- Service monitoring (FTP, DNS, SSH, MAIL, DNS, HTTP etc.. )
- Port monitoring (22, 80, 443 etc.)
- All in one Dashboard.
- Powerful charts.
- Suitable for small to mid-range servers environment.
- Configurable EMAIL, Skype Alerts.
- Free Server UP/Down Alerts.
- No load for your system since its lightweight.
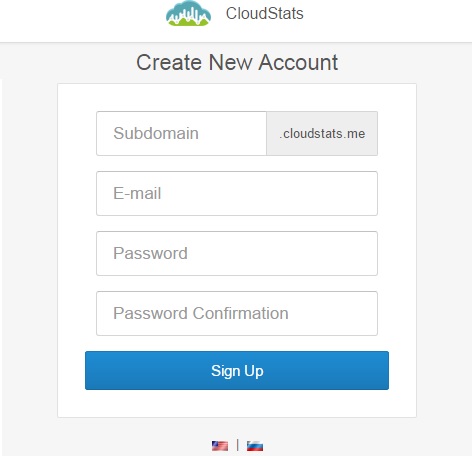
1. Sign-up in Cloudstats.me. “Subdomain” name could be anything. You can also keep your organization or website name. Here I have just used my name.
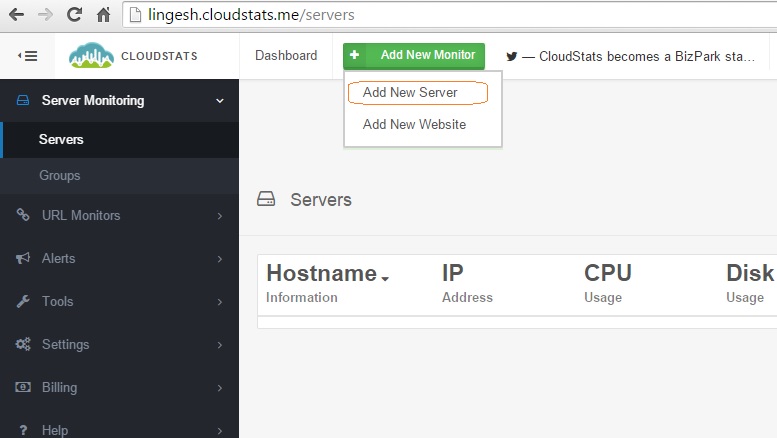
2. Once you sign-up , you will be re-directed to dashboard. Click on “Add New Monitor” and Select “Add New Server” .
3. Choose the operating system type. Here I am choosing Linux.
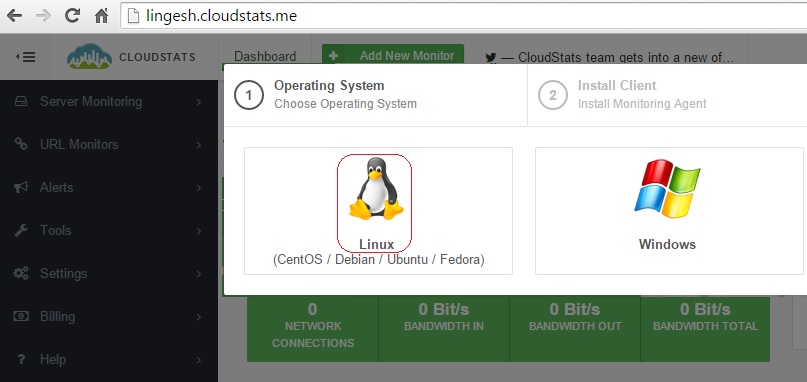
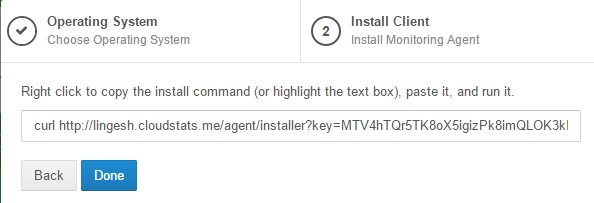
4. You will get the below screen once you have select the OS type. Copy the URL .
5. Login to the Linux server which you would like to add it in the cloudstats monitoring.
login as: root
root@192.168.203.141's password:
Last login: Wed Jun 24 09:24:26 2015
[root@RHEL7 ~]#
[root@RHEL7 ~]#
Note: You must login as a root.
6. Paste the curl URL which you have copied in the step 4.
[root@RHEL7 ~]# curl http://lingesh.cloudstats.me/agent/installer?key=MTV4hTQr5TK8oX5igizPk8imQLOK3kI6P5ISqm5pbFkTr5c9Q6d6655mebCOJvrJJ | sh
  % Total    % Received % Xferd  Average Speed   Time    Time     Time  Current
                                 Dload  Upload   Total   Spent    Left  Speed
100  1518  100  1518    0     0   1362      0  0:00:01  0:00:01 --:--:--  1365
CloudStats agent will be installed in:
/home/cloudstats_agent

Downloading cloudstats.py ...
Setting permissions on cloudstats.py ...
Downloading cloudstats_core.py ...
Downloading cloudstats_services.py ...
Installing CRON entry ...
Running first time ...
which: no aptitude in (/usr/local/sbin:/usr/local/bin:/sbin:/bin:/usr/sbin:/usr/bin:/root/bin)
Status posted to https://lingesh.cloudstats.me/status/update?key=MTV4hTQr5TK8oX5igizPk8imQLOK3kI6P5ISqm5pbFkTr5c9Q6d6655mebCOJvrJJ
Server updated
Installation finished.
[root@RHEL7 ~]#
7. Once the installation is completed, you can see that cloudstats process is started.
[root@RHEL7 ~]# ps -ef |grep cloud
root     30696 30694  0 09:28 ?        00:00:00 /bin/bash -c /home/cloudstats_agent/cloudstats.py >/dev/null 2>&1
root     30698 30696  0 09:28 ?        00:00:00 python /home/cloudstats_agent/cloudstats.py
root     30749 30483  0 09:28 pts/1    00:00:00 grep --color=auto cloud
[root@RHEL7 ~]# cd /home/
[root@RHEL7 home]#
8. The automated cloudstats installation will made the entry in the system crontab as well to report the statistics to cloudstats server for every four minutes.
[root@RHEL7 ~]# cat /etc/crontab
SHELL=/bin/bash
PATH=/sbin:/bin:/usr/sbin:/usr/bin
MAILTO=root

# For details see man 4 crontabs
# Example of job definition:
# .---------------- minute (0 - 59)
# |  .------------- hour (0 - 23)
# |  |  .---------- day of month (1 - 31)
# |  |  |  .------- month (1 - 12) OR jan,feb,mar,apr ...
# |  |  |  |  .---- day of week (0 - 6) (Sunday=0 or 7) OR sun,mon,tue,wed,thu,fri,sat
# |  |  |  |  |
# *  *  *  *  * user-name  command to be executed

*/4 * * * * root /home/cloudstats_agent/cloudstats.py >/dev/null 2>&1
[root@RHEL7 ~]#
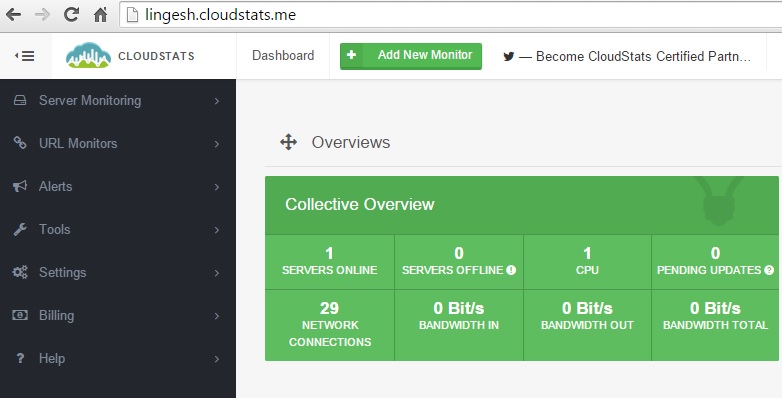
9. Let me go back to the cloudstats.me portal .
In the dashboard ,you can see that server has been added in the cloudstats monitoring.
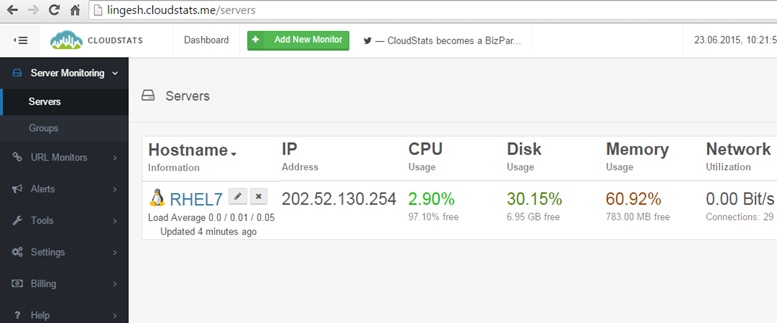
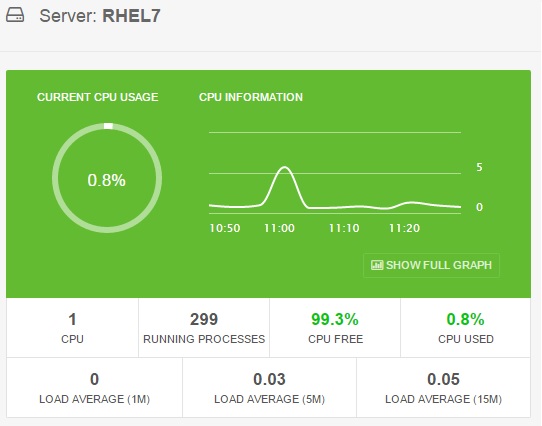
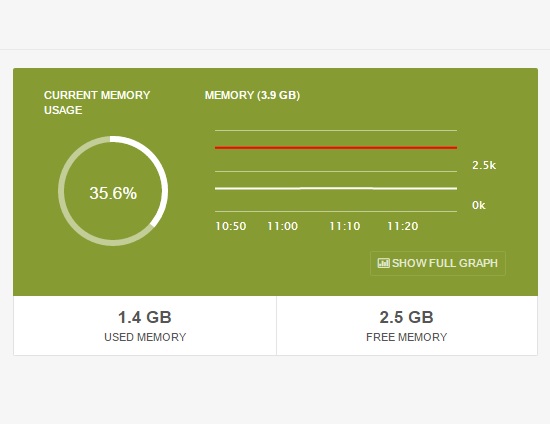
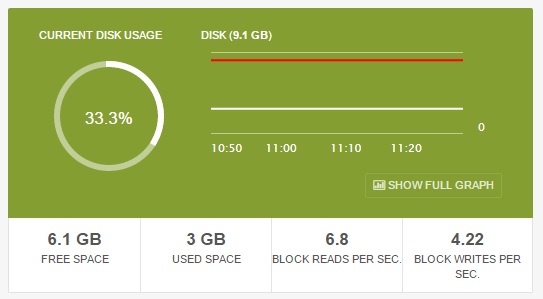
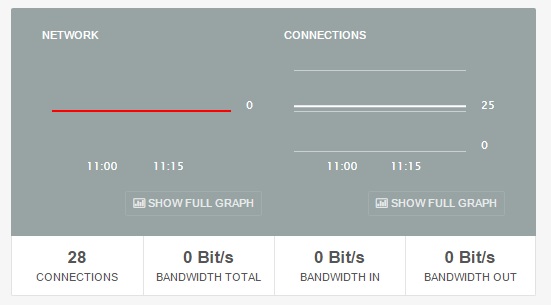
10. Click on the “SERVES ONLINE” tab which shows in the above screenshot. This will shows the servers resource utilization like below.
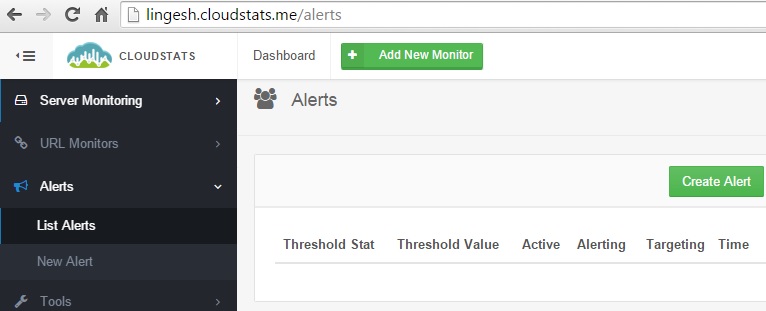
11. Click on the “Alerts” tab to configure the customized alerts. Click on “Create Alert” tab.
12. In this screen, you need to choose the pre-defined alerts type and specify the threshold value.
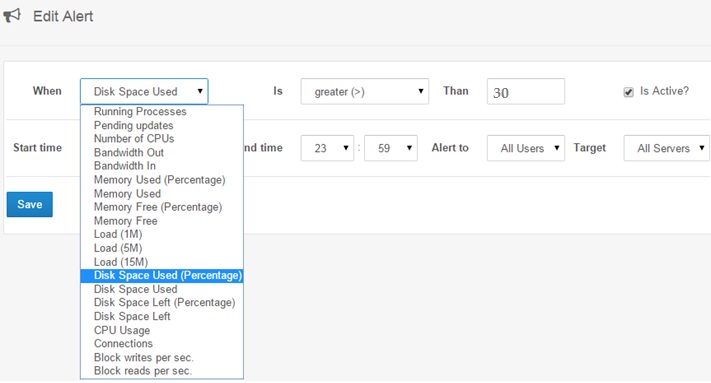
[box type=”note” align=”” class=”” width=””]In this threshold tab, i have specified as 30 for testing purpose. Normally that will be 90%. [/box]
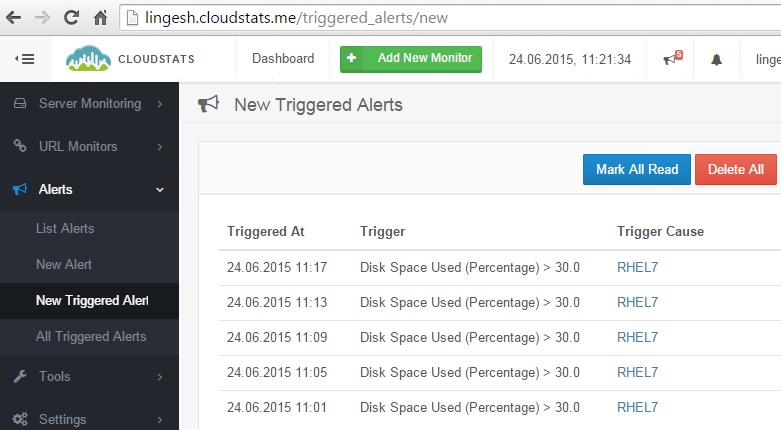
13. Once the alert has been created, cloudstats agent will monitor the specific parameter what we have defined in the previous step. According to that it will create a notification if needed.
Example:
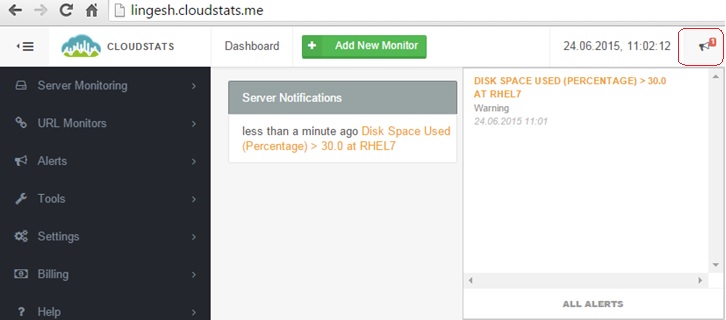
Unless you fix the issue , cloudstats will be keep on triggering the alert.
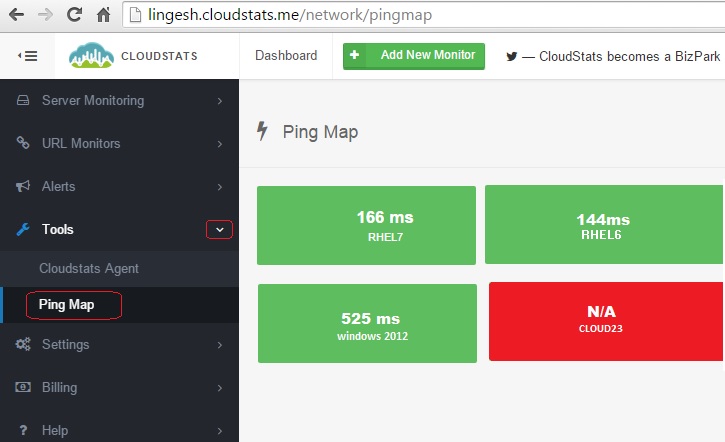
14. PingMap allows you to quickly see which of your servers are UP/Down . Here you can see host cloud23 is down or not reachable. The other three hosts are available.
15. Cloudstats can provide a wonderful graph based statistics for each hosts. You can see the server statistics by navigating to “Server Monitoring” tab- > Click on the “host”.
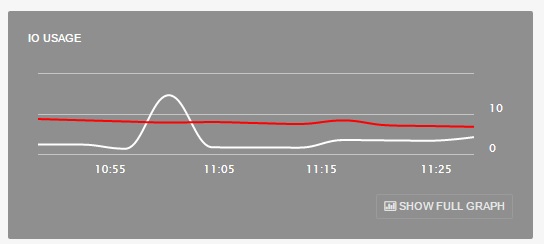
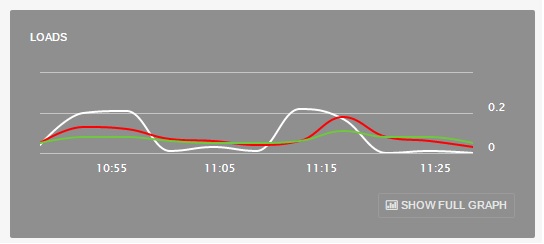
Click on the above screenshot to see image in full size.
Hope this article is informative to you. Share it ! Be Sociable !!!