

Assume you have collected the snoop output.How do you analysis it ? You can use snoop command it self to read the snoop logs.But its not user friendly.I would recommend you to use wireshark to analysis snoop output from your laptop/Desktop.Here we will see how to analysis snoop data using wireshark.
1.Download wireshark and install it in your laptop. You can download windows version from http://www.wireshark.org/download.html
2.Open a wireshark.
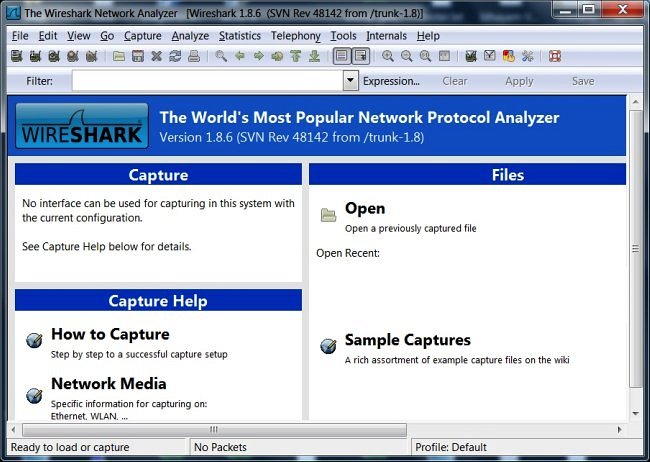
3.Go to File-> Open->Select the snoop data file from your laptop/Desktop.
You can copy the snoop data file from Unix to windows using winSCP.
4.If you not an network expertise,then you will feel very difficult to understand these outputs.But as a system admin,you check few things using wireshark filers. For an example.if you want to see only dropped packets from these snoop data,use “tcp.analysis.lost_segment” filter.Just type these filter string in that wireshark tab and apply.

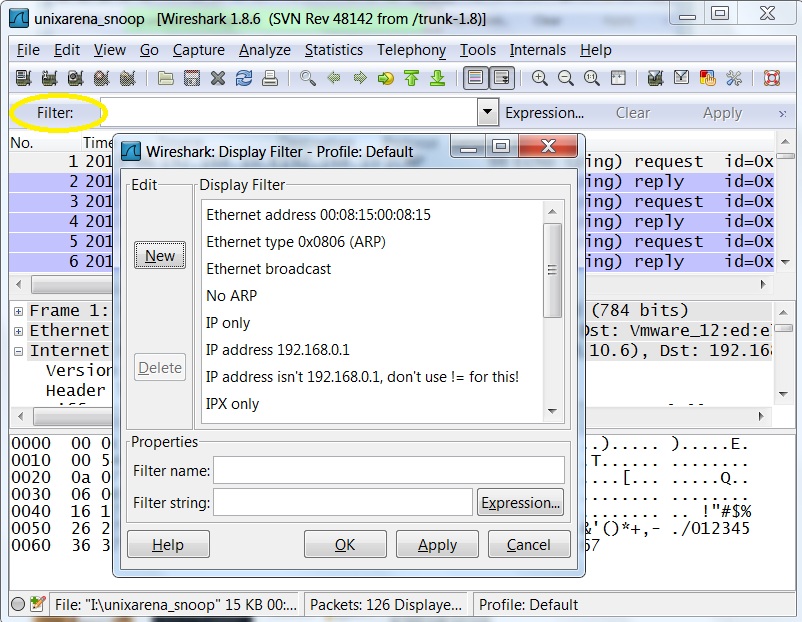
5.There are many inbuilt filters available in wireshark. To apply different filter,click on the filter tab and you will get below screen.Select the desired filter and use it.
6.For an example,if you want to filter results with specific post,use “tcp.port==por_number” filter like below. UDP filter:For an example, To filter DNS traffic, use “udp.port==53”.

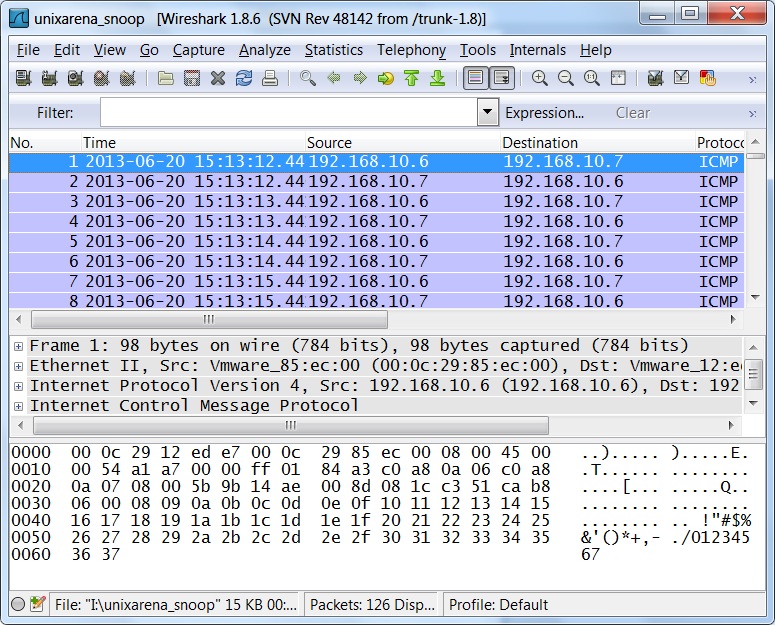
7.You can also use protocol name as filter.For an example,if you want see only http protocol traffic,just type “http” filter tab and apply.In the below example, i have used “icmp” filter to see only ping requests.

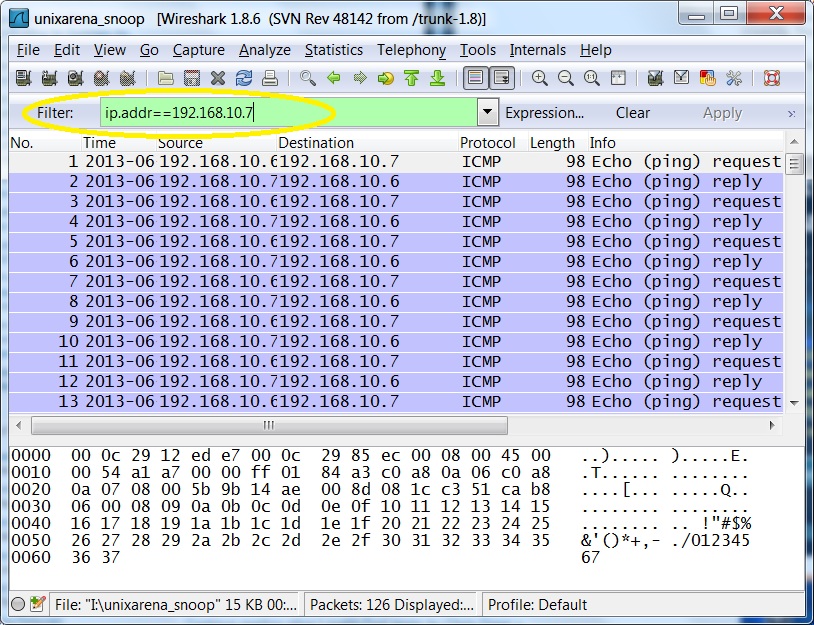
8.In some cases,you need to find one specific IP address traffic where this IP can be destination or source.In this situation,you need to use filter like below one.
9.To see only http “get” request from all IP’s use below filter.
http.request
12. To see the conversation between the two defined IP addresses use the below filter.
Note:Replace the IP address with yours systems one.
ip.addr==192.168.10.6 && ip.addr==192.168.10.7
13. To displays all re-transmissions in the snoop trace,use the below filter.
tcp.analysis.retransmission